What Does an Analyst Do?
Asked by a friend...

Context
My good friend asked me to explain the job of an Analyst.
I’ll share my answer with (admittedly) a Tech industry angle. But it will scale to Analyst jobs, generally.
Explanation
Tailored, a bit, to folks working in the Tech industry…
The job of an Analyst, as the job of a Product Manager, or even Salesperson, can be a bit flexible. A Salesperson may be responsible for getting new customers, growing relationships with pre-existing customers, or managing the relationship with a pre-existing customer, chiefly goaled on keeping them happy (read: Not losing the business). A Product Manager may be tasked with creating or fixing internal tools (optimizing for cost and/or time savings, etc.), developing new tools (optimizing for product adoption, driving revenue, etc.), or many, many other possibilities.
A job in Analytics, similar to one in Sales and Product, is not one-size-fits-all.
The stated jobs of most Analysts will be to 1) Find opportunities in data to drive toward a goal — where that goal is often to make money, but not always. In practice, Analysts may spend a lot of time 2) Sorting through data to pull accurate reporting, or be an expert on how to help others pull reporting and make sense of its output.
Note: Some Analytics goals alternative to driving revenue may relate to:
Product Analytics, focused on Product adoption and user experience.
Marketing Analytics, focusing on measuring brand awareness and driving toward specific consumer behaviors.
Medical Analytics, measuring treatment efficacy.
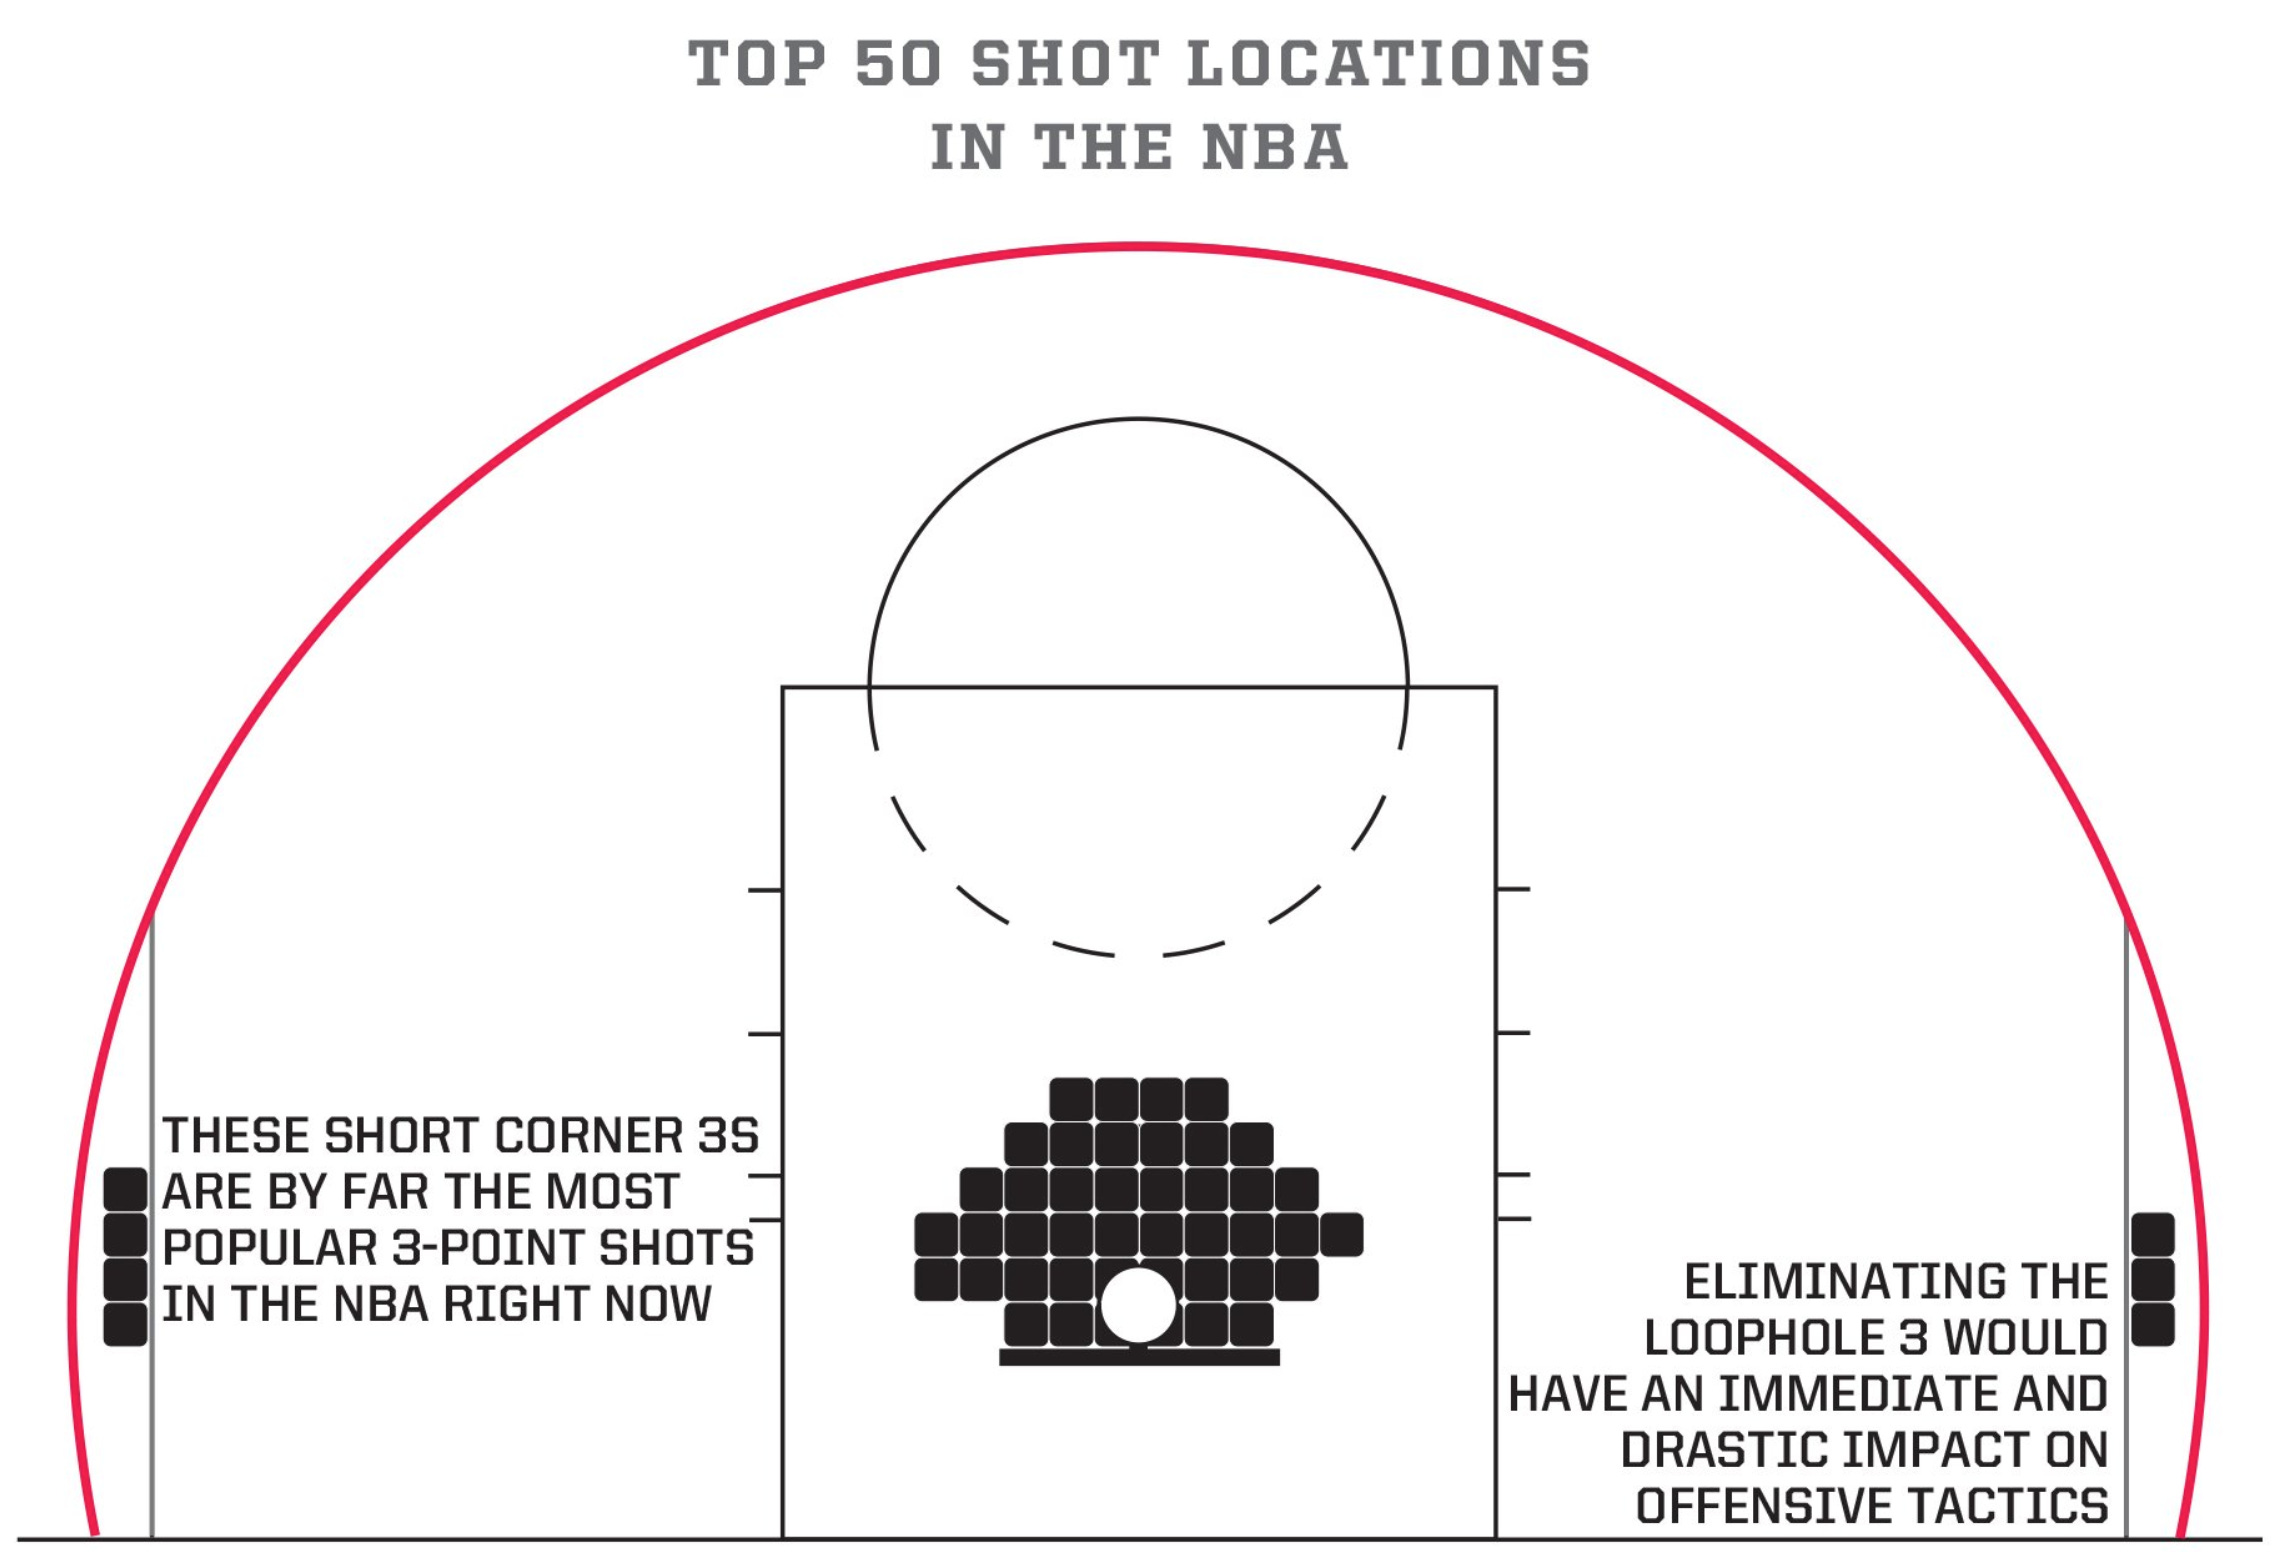
Sports Analytics, focused on getting more runs, improving athlete health / limiting injury, scoring more points, etc. A great example here would be what is affectionately known in the NBA as an “Analytics shot” — a shot that analytics suggests is worth pursuing, ie. From a specific spot on the floor, like the shorter-than-other-three-point-shots corner three.
1) Proactive Insights
A Sales team will often have a story in mind that they would like to tell. In a perfect world (at least, an Analyst’s perfect world!), stories would be informed, if not created, by data. In practice, often times a Sales person will have a story in mind already, and ask an Analyst for help finding data to support that story. In this case, Analytics will essentially be a Marketing tool. An audience will expect supporting data, and you help provide it. And, for many Analysts, the more business context, the better. In this example it helps us look at the data through the lens that is most relevant to the story that is looking to be told. Consider that this is an environment where there are typically infinite ways to cut up and present information (the data). Some “ground rules” or guidance, informed by context and aligning on if there is already story you are driving toward, go a long way.
Sales teams are very good at coming up with a story based on their qualitative knowledge of a business — that is typically a mixture of their understanding of a client’s business / preferences, the product / service the Sales team is offering, and industry trends. But many Sales people are relationships focused, not necessarily as data / numbers-oriented. So another way an Analyst can help is, rather than providing data to help prove a story Sales is looking to tell, we can run an experiment to vet whether Sales’ “gut” is correct, proving if an idea would be a good one to achieve the goal.
The third way an Analyst can help, and this is typically an ideal dynamic to operate in for an Analyst, is: An Analyst will find and uncover new opportunities that were off the Sales team’s radar — opportunities that are “hidden” in data. Then the appropriate Sales and strategic teams will help us figure out how to “profit” (defined loosely). More on this in point (2).
A talented Analyst, the “unicorn” in this universe, is one who has the ability to both mine and manipulate data at scale, glean insights, and maintain relationship with external clients / understand how their business needs map to the product, service, or idea we are selling. This Analytical Consultant serves the role of both Analyst and Sales / Relationship Manager.
2) Reporting
We are currently in a 50+ year transition from o̶l̶d̶ incumbent companies undergoing digital transformation, and getting data in a format that is “at the fingertips” of decision makers. In the meantime, there is a long, long road to many analyst jobs requiring a certain amount of expertise in the nuances specific to a company’s quirks / special considerations in how it stores data, and how to extract it. In many cases, due to technical resources, security considerations, and business change like mergers, field deprecation, etc., ramp up on how to access that data is both significant and fluid. It is likely to change, materially, each year, or even quarter. While many companies like to drive toward proactive insights, what many senior non-Analyst decision makers currently misunderstand in my observation is that in order to accomplish this, reliable and accurate data must be available at our fingertips. Many companies are in a state currently where there is so much nuance in data storage / access, that this is not possible. To make it possible, we must eliminate the nuance / ambiguity. This is an attainable goal. Also important to an Analyst is that access to information about a client’s strategy and business to marry the qualitative and quantitative story.
Closing Thoughts
I hope this serves as an adequate “101-type” explanation, and perhaps a bit of editorial in my 10+ years experience as an Analyst, for what an Analyst does, taking an angle focused on an Analyst working in the Tech industry. There are subsets of Analytics that I did not cover, such as Product, Sports, etc. However, typically, what I said above holds: The end goal is driving an idea or business forward, if not accurate reporting and helping decision makers better understand the subject of interest. Differences between disciplines will be more semantic than material to that explanation.
I would be remiss to not mention Data Science, which may be more focused on running experiments, or machine learning. It is overlapping, but often thought of as distinct, from Analytics.
What else am I missing? What else comes to mind? Thank you for reading!
-Drew
—
Examples
(1) Proactive Insights
If you were to lower your price by $x, we can predict that you will get y% more business, for a total expected profit of.
Furthermore, the long term market changes we expect this price drop to be are $z.
Or
We can see that at your price of $x, you are not enticing buyers to change their behavior or interest in your service any more than if you were selling your service for $y. By charging $y, you will do the same volume of Sales, but capture more revenue, and keep costs the same.
(2)
Reporting
Wolin Enterprises merged with Trillyin Inc to form Trolin. Both report on Revenue and Impressions — an advertising term that gets ticked each time an ad is shown. Example: You visit a website, you see 1 ad, you were served 1 Ad Impression, and the website served one Ad Impression.
It is possible a business will serve serve more-than-billions of Ad Impressions in one week! This is real, not just for a hypothetical! As such, I hope it is clear why robot-assisted methods of manipulating data are required to make any sense of it.
WE and Trillyin used two different technologies, with different naming conventions, and different caveats to how to pull exactly the right data (Do you want USA only, or global? Do you want data only for a subset of clients? And if so, how are those clients defined for Trillyin, and how are they defined for WE?).
Sales people will not be able to keep track of the nuance — they are too busy getting new clients, or keeping existing clients happy. It is a full time job to understand these nuances (remember: Above I gave a simple illustrative example, but it does not even begin to capture the full picture).
Tip: Make it even more illustrative. Paint a very specific picture of something very specific I did or do. Just use my name and real companies and change it later.
Here is an example of a gorgeous data visual. Fine storytelling.
The visual at the bottom of the page, captioned, "On transit streets where buses and bikes operate in a shared lane at low speeds..."
https://nacto.org/publication/transit-street-design-guide/transit-lanes-transitways/transit-lanes/shared-bus-bike-lane/?fbclid=IwAR10VN16A0llzXbQ5lHZhykbgwtE6-SQlJAw9qTi_VussCZC2WN69EFR7mQ